

AI Stock Chart Analyst
AI Stock Chart Analyst is made and published by PAPRCLIP TECHNOLOGIES PRIVATE LIMITED. AppBrain is an independent app data site and isn't affiliated with PAPRCLIP TECHNOLOGIES PRIVATE LIMITED. The app name, icon, screenshots and description belong to PAPRCLIP TECHNOLOGIES PRIVATE LIMITED and are shown as published on the App Store.
AppBrain's verdict
- Last updated
- July 22, 2026
Rankings
App Store top chartsApp Store Rankings for AI Stock Chart Analyst
Competitors
Similar apps and more from PAPRCLIP TECHNOLOGIES PRIVATE LIMITEDAlternatives to AI Stock Chart Analyst


More from PAPRCLIP TECHNOLOGIES PRIVATE LIMITED


Releases
Updates seen on the App Store- Version
- 1.1
- Launched
- May 2026
No changelog data
User feedback
Ratings and reviews on the App StoreComments on AI Stock Chart Analyst for iOS
We don't have enough comments to show example comments. Please check back later.
Technology
Found in the app by AppBrain- Price
- Free
- App size
- 40.1 MB
- Content rating
- Everyone
Technologies used by AI Stock Chart Analyst
About the app and developer
About AI Stock Chart Analyst
AI Stock Chart Analyst is a finance app developed by PAPRCLIP TECHNOLOGIES PRIVATE LIMITED.
User Ratings
The app has no ratings yet.
App Information
AI Stock Chart Analyst is freely available from the App Store. The app size is 40.05 MB. The latest version available is 1.1. The last update was on July 22, 2026.
Technical Requirements
The app has a content rating of Everyone. The app has been available on the App Store since May 2026.
Developer information for PAPRCLIP TECHNOLOGIES PRIVATE LIMITED
Store listing
By PAPRCLIP TECHNOLOGIES PRIVATE LIMITED, from the App Store

Description by PAPRCLIP TECHNOLOGIES PRIVATE LIMITED Written by the developer, not by AppBrain. Click to read.
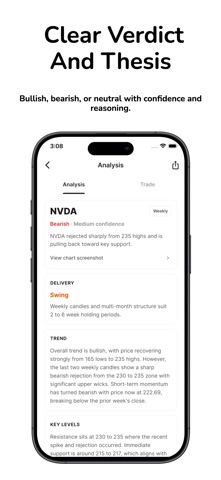
The AI reads candlestick patterns, support and resistance levels, indicator readings, trend direction, and chart structures — then delivers a clear, structured breakdown in plain language.
Upload charts from any market. Stocks, forex pairs, cryptocurrency, indices, and commodities are all supported. Works across any timeframe from one-minute intraday charts to weekly swing setups.
What gets analyzed
Candlestick patterns including doji, hammer, shooting star, engulfing, morning star, and harami. Indicators including RSI, MACD, Bollinger Bands, EMA, and SMA when visible. Chart patterns including head and shoulders, double top, double bottom, triangles, flags, pennants, and wedges. Support and resistance zones, trend lines, channels, and potential breakout levels are identified with every analysis.
How to use it
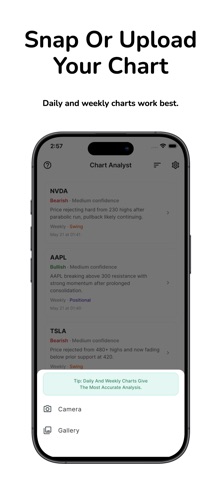
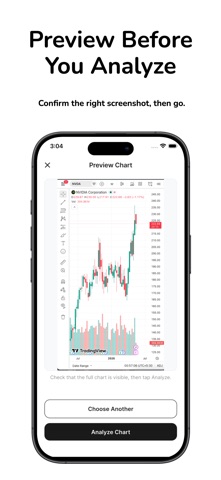
Open the app, upload a screenshot from your gallery or take a photo of any chart, and your analysis arrives in seconds. No account required, no setup, no manual input.
Built for every trader
Intraday traders get fast chart reads during live sessions. Swing traders identify multi-day setups across timeframes. Beginners get plain-language explanations of every pattern and signal. Experienced traders use it as a second opinion before entering a position.
Your privacy
Chart images are processed securely. No screenshots, analysis history, or trading data is stored or shared.
Disclaimer
AI Stock Chart Analyst is for educational and informational purposes only. Nothing in this app constitutes financial advice or trading recommendations. Trading involves substantial risk of loss. Always do your own research and consult a qualified financial professional before making investment decisions.
Terms - https://paprclip.app/terms