Bode Plot Calculator was an overall app developed by Edoardo Orzes. It was removed from Google Play Jan 25, 2025 and is no longer available for download.
Download Statistics
User Ratings
The app had no ratings.
App Information
Bode Plot Calculator cost $3.99 to download. The APK download size was 4.04 MB. The last available version was 1.1. The last update was on April 21, 2024.
Technical Requirements
The app had a content rating of Everyone. The app had been available on Google Play April 2024.
Description
This is not a standard scientific calculator, it is optimized to evaluate Bode plots and Nyquist diagrams.
This calculator is also fully compatible with the complex domain and standard graphs in time domain (linear).
Writing a calculation produces the numeric result, as any calculator, while adding the variable t produces a plot in time domain. Inserting f, omega or s instead, produces the Bode Plot, then it is possible to switch to the Nyquist diagram.
Functionalities:
- Nice looking interface, intuitive, immediate and able to not only replace, but to enrich hardware calculators. - Elegant and modern themes and colors to choose from, all included in the first purchase. - A little magic feature: in scientific notation, swipe over the result to move the decimal dot and see the ten power change :)
- All scientific function (sin, cos, tan, ..., log, ln, exp, ..., atan2). - Calculation structured in 2D, with fractions, powers, roots, brackets and so on, with very easy to nest operations, no limits! - Tap on the calculation to place the cursor and write.
- Undo/Redo buttons - A catalog with 40 physics fundamentals constants, with name and unit of measure, ready to be inserted. - Possibility to store values. - Chronology.
- Sliders: yes, you can insert many parameters and change them swiping on a slider to see the effect in real time. - Spaces: access to up to 4 spaces on which you can edit and keep calculations, useful also to superpose different plots. - Joystick mode: swipe over the buttons to move the cursor (still in beta).
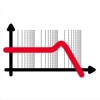
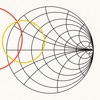
- Bode Plots: inserting a variable, s, omega or f, produces the Bode Plot, toggling on the button it switches to the Nyquist diagram. - Linear Plots: inserting the t variable, produces a plot in a linear domain.
- Complex numbers: the app automatically uses complex numbers when needed, no need to set the complex mode. - Plots also support for complex values. - Integrals and derivatives (in the future also limits).
- Export plot and calculation as image/PDF, copy result as text
Each subscription will automatically renew 3 days before the expiration date for
the same time period. Subscriptions can be cancelled at any time before the renewal.