It doesn't have enough ratings yet to judge what users think.
Chart Maker - Build Graphs is made and published by
MUSTAFA ACAR.
AppBrain is an independent app data site and isn't affiliated with MUSTAFA ACAR.
The app name, icon, screenshots and description belong to MUSTAFA ACAR and are shown as
published on the App Store.
About Chart Maker - Build Graphs
Chart Maker - Build Graphs is a productivity app developed by MUSTAFA ACAR.
User Ratings
Chart Maker - Build Graphs is rated 3.00 out of 5 stars. The rating is based on one rating ratings.
App Information
Chart Maker - Build Graphs is freely available from the App Store. The app size is 29.72 MB. The latest version available is 1.0.0. The last update was on August 22, 2025.
Technical Requirements
The app has a content rating of Everyone. The app has been available on the App Store since August 2025.
Description by MUSTAFA ACAR(from the App Store)
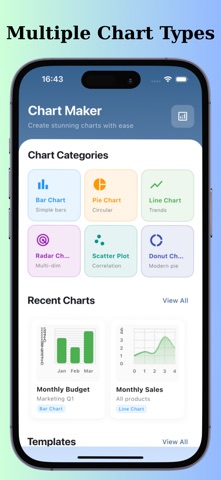
Chart Maker - Build Graphs is a powerful yet user-friendly application designed to help you create beautiful and professional charts with ease. Whether you're working on a presentation, a report, or just need to visualize data quickly, this app has got you covered. Create stunning Line, Bar, Donut, Scatter, and Radar graphs, customize them to fit your style, and display data in a way that's both engaging and informative.
Key Features:
Multiple Chart Types: Choose from a variety of chart styles including Line, Bar, Donut, Scatter, and Radar to suit your data visualization needs.
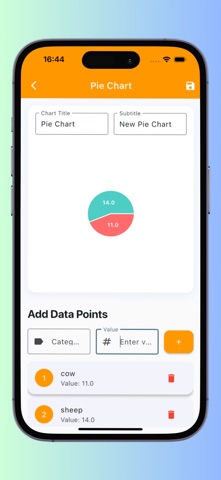
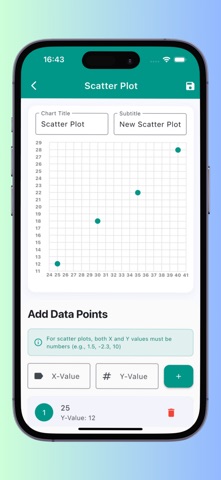
Easy Data Input: Simply enter your values and labels, and let the app do the rest. No need for complex software or technical expertise.
Customizable Designs: Customize every aspect of your charts, from colors and labels to the design and layout. Make your charts as unique as your data.
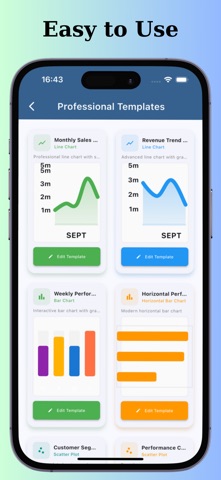
Professional Templates: Access pre-designed templates to quickly generate polished, professional charts for any purpose.
History and Reusability: View your previous charts, edit them, or reuse them for future projects. Stay organized with your past designs.
User-Friendly Interface: A simple, intuitive interface that makes chart creation effortless for users of all levels..
Data Insights: Visualize trends, comparisons, and relationships in your data through interactive and easy-to-read charts.
Why Choose Chart Maker - Build Graphs?
Whether you're a student, professional, or business owner, having the ability to quickly turn raw data into clear and visually appealing charts is essential. With Chart Maker, you can:
Visualize Data: Transform complex data into easy-to-understand charts that tell a story.
Save Time: No need for expensive software or long tutorials. Simply input your data and generate a chart in seconds.
Boost Productivity: Save time on report creation and improve decision-making with clear, insightful charts.
Create Engaging Presentations: Use your charts to make your presentations more impactful and memorable.
Who Can Use Chart Maker?
Students & Teachers: Perfect for creating charts for school projects, assignments, or teaching materials.
Business Owners & Professionals: Quickly create reports, presentations, or visualizations for meetings, clients, and stakeholders.
Data Analysts: Visualize your data efficiently and share insights with team members or clients.
Marketers: Use charts to present marketing performance, sales, and customer insights.
How It Works:
Choose Chart Type: Select from line, bar, donut, scatter, or radar chart styles.
Enter Data: Simply input your data points and corresponding labels.
Customize: Modify the colors, fonts, and layout to fit your aesthetic.
Each subscription will automatically renew 3 days before the expiration date for
the same time period. Subscriptions can be cancelled at any time before the renewal.