

ChartShot: AI Chart Analysis
ChartShot: AI Chart Analysis is made and published by Kerem Cuneyt Beyazkurk. AppBrain is an independent app data site and isn't affiliated with Kerem Cuneyt Beyazkurk. The app name, icon, screenshots and description belong to Kerem Cuneyt Beyazkurk and are shown as published on the App Store.
AppBrain's verdict
- Last updated
- October 29, 2026
Rankings
App Store top chartsApp Store Rankings for ChartShot: AI Chart Analysis
Competitors
Similar apps and more from Kerem Cuneyt BeyazkurkMore from Kerem Cuneyt Beyazkurk

Releases
Updates seen on the App Store- Version
- 1.1
- Launched
- September 2026
No changelog data
User feedback
Ratings and reviews on the App StoreComments on ChartShot: AI Chart Analysis for iOS
We don't have enough comments to show example comments. Please check back later.
Technology
Found in the app by AppBrain- Price
- Free
- App size
- 49.3 MB
- Content rating
- High
Technologies used by ChartShot: AI Chart Analysis
About the app and developer
About ChartShot: AI Chart Analysis
ChartShot: AI Chart Analysis is an education app developed by Kerem Cuneyt Beyazkurk.
User Ratings
The app has no ratings yet.
App Information
ChartShot: AI Chart Analysis is freely available from the App Store. The app size is 49.26 MB. The latest version available is 1.1. The last update was on October 29, 2026.
Technical Requirements
The app has a content rating of High Maturity. The app has been available on the App Store since September 2026.
Developer information for Kerem Cuneyt Beyazkurk
Address:
Store listing
By Kerem Cuneyt Beyazkurk, from the App Store


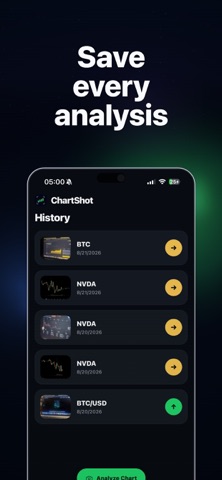

Description by Kerem Cuneyt Beyazkurk Written by the developer, not by AppBrain. Click to read.
Upload a stock, crypto, forex, index or commodity chart and explore the technical information visible on the chart through clear AI-powered explanations.
ChartShot is designed to help you understand chart structure, technical indicators, patterns, momentum, support and resistance, and other concepts used in technical analysis.
AI CHART EXPLANATIONS
Take a photo or upload a screenshot of a chart. ChartShot organizes the visible technical information into an easy-to-understand educational breakdown.
Explore:
• Trend and momentum
• Support and resistance
• Candlestick formations
• Chart patterns
• Volume and volatility
• Technical indicators
• Key areas visible on the chart
LEARN MARKET STRUCTURE
Explore how technical elements interact on a chart. ChartShot provides context to help you understand what different structures and patterns may indicate.
BUILT FOR CHART LEARNING
Whether you're learning about stocks, crypto, forex or other financial markets, ChartShot makes technical chart analysis easier to understand through structured AI explanations.
IMPORTANT INFORMATION
ChartShot is intended solely for informational and educational purposes. AI-generated content does not constitute financial or investment advice or a recommendation to buy, sell, or hold any financial instrument.
ChartShot does not execute trades, connect to brokerage accounts, manage funds, or guarantee financial outcomes. Trading and investing involve risk. Always conduct your own research and independently evaluate information before making financial decisions.
EULA: https://www.apple.com/legal/internet-services/itunes/dev/stdeula/