

Offline AI Stock Analysis
Offline AI Stock Analysis is made and published by Siva Vimel Rajhen. AppBrain is an independent app data site and isn't affiliated with Siva Vimel Rajhen. The app name, icon, screenshots and description belong to Siva Vimel Rajhen and are shown as published on the App Store.
AppBrain's verdict
- Last updated
- September 21, 2026
- Size
- 781.4 MB
User feedback
Ratings and reviews on the App StoreComments on Offline AI Stock Analysis for iOS
We don't have enough comments to show example comments. Please check back later.
Store listing
By Siva Vimel Rajhen, from the App Store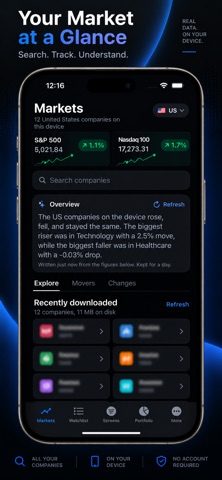


Description by Siva Vimel Rajhen Written by the developer, not by AppBrain. Click to read.
Type a ticker. Understand the business. See what a company does, whether it is profitable, whether it is growing, and how its valuation compares with its own history — all in one place.
EVERY FIGURE HAS A SOURCE
Fundamentals come directly from each company’s XBRL-tagged filings, including 10-K and 10-Q reports filed with the SEC. Tap any figure to see:
• What it measures
• What the number means in plain English
• The calculation behind it
• The accounting concept and reporting period
• The filing accession number
• A link to the original filing
No unexplained numbers. No black box.
TWELVE YEARS OF FUNDAMENTALS
Turn years of financial data into charts you can understand at a glance. Explore:
• Revenue
• Gross, operating, and net margins
• Net income
• Free cash flow
• Net debt
• Dividends per share
• Share count
BUILD SCREENS IN PLAIN ENGLISH
Create a set of conditions once, name it, and run it whenever you want.
• Describe what you're looking for in ordinary language — such as: “Profitable small caps with low debt”
• The app turns your description into editable conditions and shows exactly which words produced each filter.
• Change any condition yourself. Re-run it later. Ask the app to describe a saved screen and it explains exactly what you built.
WATCHLISTS YOUR WAY
Build watchlists around the numbers that matter to your research:
• Gross margin
• Net debt to EBITDA
• Five-year share count change
• Free cash flow
• Profitability
• Growth
• Valuation
Choose your columns. See the data you actually care about.
SEE WHAT YOU ACTUALLY OWN
A portfolio can be less diversified than it looks. Explore:
• Portfolio concentration
• Sector weights
• Correlations between holdings
• ETF look-through exposure
• Your combined exposure to the same company across multiple funds
• Position-sizing arithmetic
ALERTS ON THE BUSINESS — NOT JUST THE PRICE
Track changes that can matter to the underlying business:
• Margin compression
• Dilution
• Rising debt
• Profit failing to convert to cash
• Dividend reductions
AI THAT RUNS ON YOUR DEVICE
• The language model runs locally on your device.
• It helps explain financial information in readable language, but it does not invent financial figures.
• Every number shown by the app is computed from the underlying financial data in code. AI-generated explanations are checked against those computed values. If the model produces an unsupported number or recommendation, it is rejected.
NO VERDICTS
This app does not tell you what to buy or sell. There are:
• No buy, sell, or hold ratings
• No price targets
• No confidence scores
• No price predictions
• No community picks
FINANCIAL TERMS, EXPLAINED OFFLINE
Choose between two reading levels:
• Plain English — straightforward explanations.
• Analyst — concise, technical terminology.
PRIVATE BY DESIGN
• No account required.
• No analytics.
• No tracking.
• No advertising identifier.
• No cookies.
ONE PURCHASE
• No subscription.
• No feature tiers.
• No recurring payment.
• No artificial limits.
WORKS OFFLINE
•Ticker search for SEC-registered companies is built into the app.
• Download a company once and its available charts, screens, financial data, and explanations can continue working without an internet connection.
TRANSPARENT ABOUT LIMITATIONS
• The app is designed to show you exactly what it knows — and what it doesn't.
• Screens run only across companies you have downloaded, not automatically across the entire market.
• Prices are delayed end-of-day closes, and screens show when their underlying data was downloaded.
The app does not summarize legal filings, provide community recommendations, or generate investment predictions.
You bring the questions. The filings provide the numbers. The app helps you understand them.
Safety and technology
Found in the app by AppBrain- Price
- $9.99
- App size
- 781.4 MB
- Content rating
- Everyone
Technologies used by Offline AI Stock Analysis
Releases
Updates seen on the App Store- Version
- 1.0
- Launched
- September 2026
No changelog data
Alternatives
Similar apps and more from Siva Vimel RajhenMore from Siva Vimel Rajhen





Rankings
App Store top chartsApp Store Rankings for Offline AI Stock Analysis
About the app and developer
About Offline AI Stock Analysis
Offline AI Stock Analysis is a finance app developed by Siva Vimel Rajhen.
User Ratings
The app has no ratings yet.
App Information
Offline AI Stock Analysis costs $9.99. The app size is 781.37 MB. The latest version available is 1.0. The last update was on September 21, 2026.
Technical Requirements
The app has a content rating of Everyone. The app has been available on the App Store since September 2026.
Developer information for Siva Vimel Rajhen
Address:
Frequently asked questions about Offline AI Stock Analysis
Is Offline AI Stock Analysis free?
No. Offline AI Stock Analysis costs $9.99 on the App Store.
Is Offline AI Stock Analysis still available?
Yes. Offline AI Stock Analysis is on the App Store, and the last update we saw was on September 21, 2026.
How large is Offline AI Stock Analysis?
Offline AI Stock Analysis is 781.37 MB.
Is Offline AI Stock Analysis suitable for children?
App Store rates the content of Offline AI Stock Analysis as suitable for everyone.
Who made Offline AI Stock Analysis?
Offline AI Stock Analysis was developed by Siva Vimel Rajhen. It is listed in the finance category on the App Store.