Chart AI - Technical Analysis is an overall app developed by VIKSVA, MB.
Download Statistics
User Ratings
The app has no ratings yet.
App Information
Chart AI - Technical Analysis is FREE to download. The APK download size is 269.52 MB. The latest version available is 1.1. The last update was on July 29, 2026.
Technical Requirements
The app has a content rating of Everyone. The app has been available on Google Play February 2026.
Description
Chart AI analyzes your trading charts using artificial intelligence. Simply screenshot any chart and get detailed technical analysis with indicators, patterns, and trade levels.
AI-POWERED CHART ANALYSIS
• Scan any chart screenshot from TradingView, MT4, MT5, or any platform • AI analyzes candlestick patterns, price action, and market structure • Get support and resistance levels identified automatically • Receive trend direction and strength analysis • View RSI, MACD, Bollinger Bands, and Moving Average readings
MULTI-TIMEFRAME ANALYSIS
• Analyze two timeframes simultaneously for confluence • Higher timeframe for trend direction (Daily, Weekly, Monthly) • Lower timeframe for entry timing (4H, 1H, 15M, 5M, 1M) • See how timeframes align for stronger trade setups
TECHNICAL INDICATORS
• RSI - Overbought/oversold conditions and divergences • MACD - Trend momentum and crossover signals • Bollinger Bands - Volatility and price position analysis • Moving Averages - Trend direction and dynamic support/resistance • Volume analysis when visible on chart
TRADE ANALYSIS
• Entry, stop-loss, and take-profit levels • Risk/reward ratio calculation • Confidence scoring for each analysis • Bullish and bearish scenario breakdowns • Key levels to watch
TRADE JOURNAL
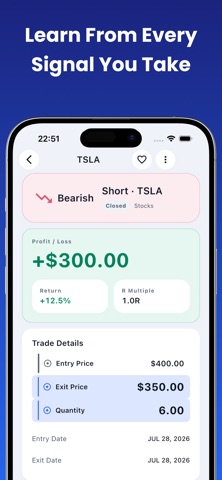
• Log your trades and keep them all in one place • Track your win rate and results over time • Revisit your analysis history whenever you need it
WORKS WITH ALL MARKETS
• Stocks - S&P 500, NASDAQ, NYSE, global exchanges • Cryptocurrency - Bitcoin, Ethereum, altcoins • Forex - Major, minor, and exotic currency pairs • Commodities - Gold, silver, oil, natural gas • Indices - SPX, DJI, FTSE, DAX, Nikkei
HOW IT WORKS
1. Screenshot any chart from your trading platform 2. Open Chart AI and select or capture the image 3. AI processes the chart and identifies patterns 4. Review the detailed technical analysis 5. Use insights for your trading research
FREE & PREMIUM
Free: Limited daily analyses Premium: Unlimited AI analysis, multi-timeframe scanning, full indicator suite
PRIVACY
Your chart screenshots are processed securely. We do not share your trading data or analysis history with third parties.
---
IMPORTANT DISCLAIMER
Chart AI is designed for educational and informational purposes only. The analysis, signals, and information provided by this app do not constitute financial advice, investment advice, trading advice, or any other form of professional advice.
Trading stocks, cryptocurrency, forex, and other financial instruments involves substantial risk of loss and is not suitable for all investors. Past performance does not guarantee future results. You should never trade with money you cannot afford to lose.
Always conduct your own research and consult with a qualified financial advisor before making any investment decisions. The developers of Chart AI are not responsible for any trading losses incurred.
---
Terms of Service: https://apps.viksva.com/chartsai/chartai_terms.html Privacy Policy: https://apps.viksva.com/chartsai/chartai_privacy.html
Each subscription will automatically renew 3 days before the expiration date for
the same time period. Subscriptions can be cancelled at any time before the renewal.