Mapping the Android world: where developers are, and where the downloads actually go
Everyone has a mental model of where Android apps come from. Most people picture the US, maybe India, maybe China. The reality is more interesting than that — and the gap between where developers are and where the downloads actually land is bigger than we expected.
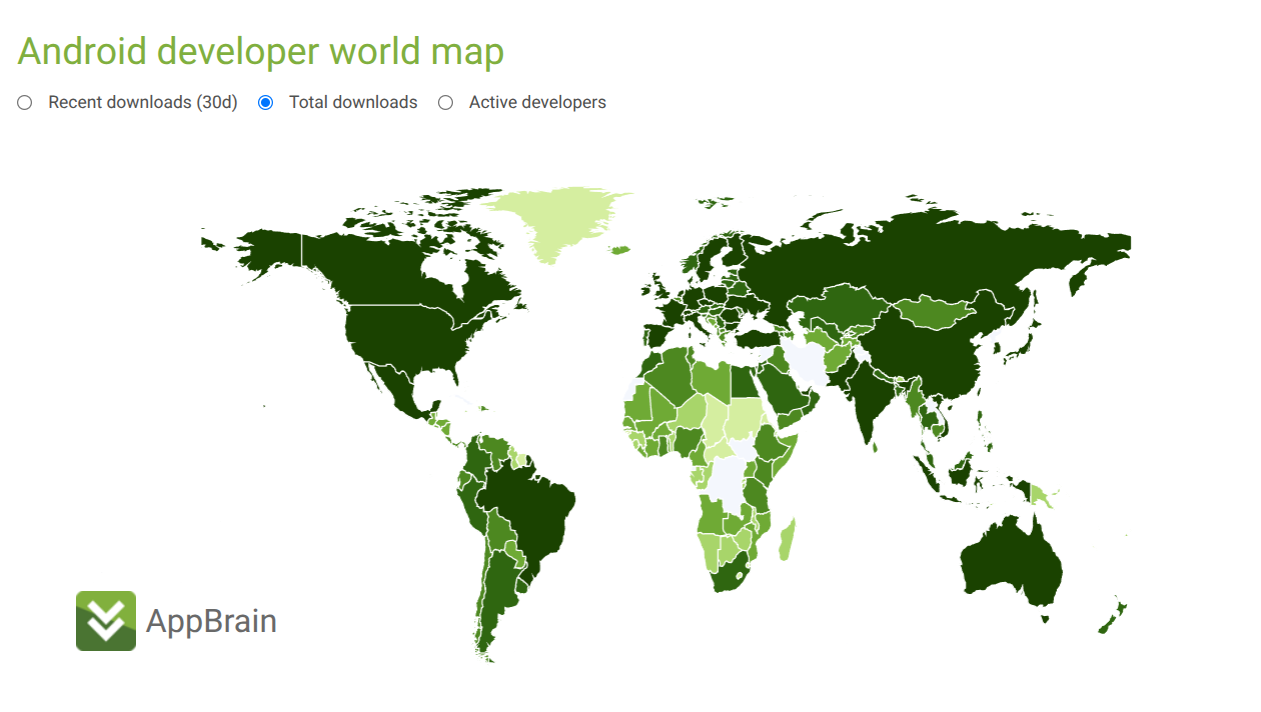
So we built a tool to show it. The new developer world map turns our index into an interactive view of the global Android developer landscape: a colored world map plus a sortable country table, with a toggle to rank by recent downloads (last 30 days), total downloads, or active developers.
The headline: the US is #1, but it’s not close on raw developer count
The United States tops every metric. We track 52,511 active developers there, pulling 7.8B downloads in the last 30 days and 686.8B all-time. A single publisher — Google LLC — accounts for 5.4B of that recent total, with Motorola, Microsoft, Meta, WhatsApp and Instagram filling out the rest of the top of the list.
But look one row down the developer count and you find India with 49,369 active developers — nearly as many as the US — yet only 1.0B recent downloads. More developers does not mean more installs. India is building a huge volume of apps; the download weight sits elsewhere.
The real surprise: tiny countries, enormous download volume
Sort the table by recent downloads and the story flips. Singapore ranks #2 in the world — 1.5B downloads in 30 days, 90.7B all-time — off the back of fewer than 3,000 active developers. Right behind it: Hong Kong (#4, 917M) and China (#5, 841M), neither of which cracks the top of the developer-count ranking either.
What’s going on? A handful of giant publishers can outweigh an entire country’s developer base. Click into Singapore and it’s immediately obvious: the top developers are HeyTap, ColorOS, TikTok Pte. Ltd., Bytedance Pte. Ltd. and Garena — global-scale operations headquartered there, each moving tens or hundreds of millions of installs a month. A few of those outweigh thousands of indie developers somewhere else.
Click any country to go deeper
The map isn’t just a leaderboard. Click any country and you get its rank, its active developer count, its recent and total downloads, and a ranked list of its top developers — with the same recent / total / upcoming toggle. It’s a fast way to answer questions like:
- Who are the biggest publishers in a given market? Useful before you localize or launch there.
- Where is download volume concentrated vs. spread across many developers? The US and India spread it across tens of thousands of devs; Singapore and Hong Kong concentrate it in a few.
- Which markets are over- or under-served relative to their developer base? The mismatch is the opportunity.
Why we built this
Most of our tools start from a single app and drill down — download history, rankings, SDKs. This one zooms all the way out. It’s the same dataset behind AppBrain Intelligence, viewed from 10,000 feet: the shape of the whole Android developer world in one screen.
Explore it now: the developer world map is live and free to browse. Pick a metric, find a country, and tell us what surprised you — feedback always welcome at contact@appbrain.com.